Most Notion project tutorials have the same problem: they show you how to build the system, but not show you what happens after you have lived with it for a few weeks. The database looks great on day one. You create a Projects database, a Tasks database, add Status, Assignee, Due Date, Priority and maybe a few formulas, then create a Kanban board. At that point, one think the problem has been solved. It hasn't. A project management system doesn't become useful because it contains the right properties. It becomes useful when a team can use it repeatedly without fighting the system.
That was the reason for this 30-day test. I treated the workspace as an operating system for a small project team. The test environment contained five people, 11 active projects and 184 tasks over the month. The work was mixed: content production, website changes, design, research, marketing and operational tasks. The system had to handle planning, requests, deadlines, review work and workloads. The question was not whether Notion could technically support those workflows. It obviously could. Notion databases support relations, rollups, formulas, multiple views and filtering...also task databases can also support assignees, due dates and sprints.
Many features that were useful during the initial build were removed before the end of the month. Main improvement came from reducing the number of decisions users had to make.
The Problem We Started With
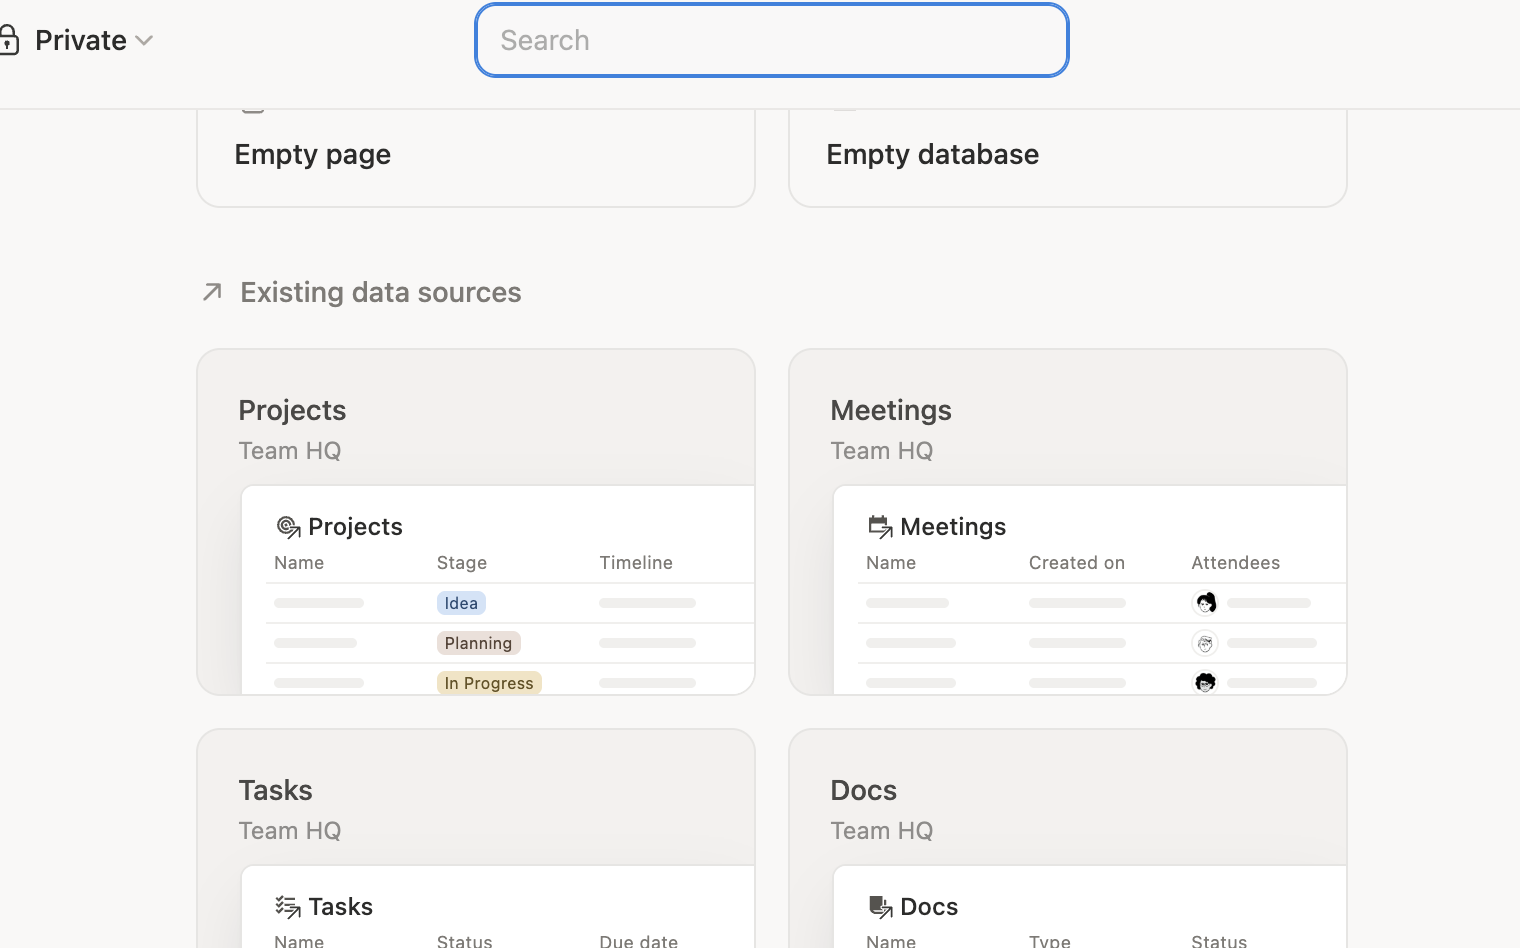
The first version of the workspace was close to the architecture recommended in most Notion tutorials: one Projects database and one central Tasks database. The Projects database had these things:- project name, status, owner, start date, target end date and priority. The Tasks database had these things:- the task name, project relation, assignee, status, due date, priority, effort and sprint.
The relation between Tasks and Projects was important because it stopped the workspace from fragmenting into separate databases. Notion's relation property is to connect items between databases. Task database connected to a projects database is one of the examples supported by Notion's own documentation. Rollups can then aggregate information from those related records.
The architecture had a hidden problem. We were storing information because it might be useful rather than because the team had proven that it was useful. During the first build, the system contained 17 task properties. By the end of the test, only 11 remained in the core workflow. Six were removed because they created more maintenance than value.
A property was allowed to stay if it helped answer a real question, supported a filter or sort or provided information that somebody actually used. A property that merely made the database look more sophisticated was eventually removed.
The 30-Day Test Setup
The test was split into four stages.
During the first week, the goal was - create data structure and use it. The second week focused heavily on Kanban and daily task flow. The third week was dedicated to planning and Timeline analysis. The fourth week concentrated on workload, backlog cleanup and system simplification.
This mattered because a brand-new workspace hides the problems that appear only after data accumulates. Twenty tasks look manageable. A hundred and eighty-four tasks expose every bad naming convention, unnecessary field and weak filter.
The test also used a small set of practical measurements. We recorded how long it took to answer this - "What is due this week?", "Who is overloaded?", "What is waiting for review?" and "Which projects are drifting?" We also tracked - how many tasks were missing an owner - how many had no due date - how many remained in the backlog for more than 30 days.
Week One: The Database Was good but not Workflow
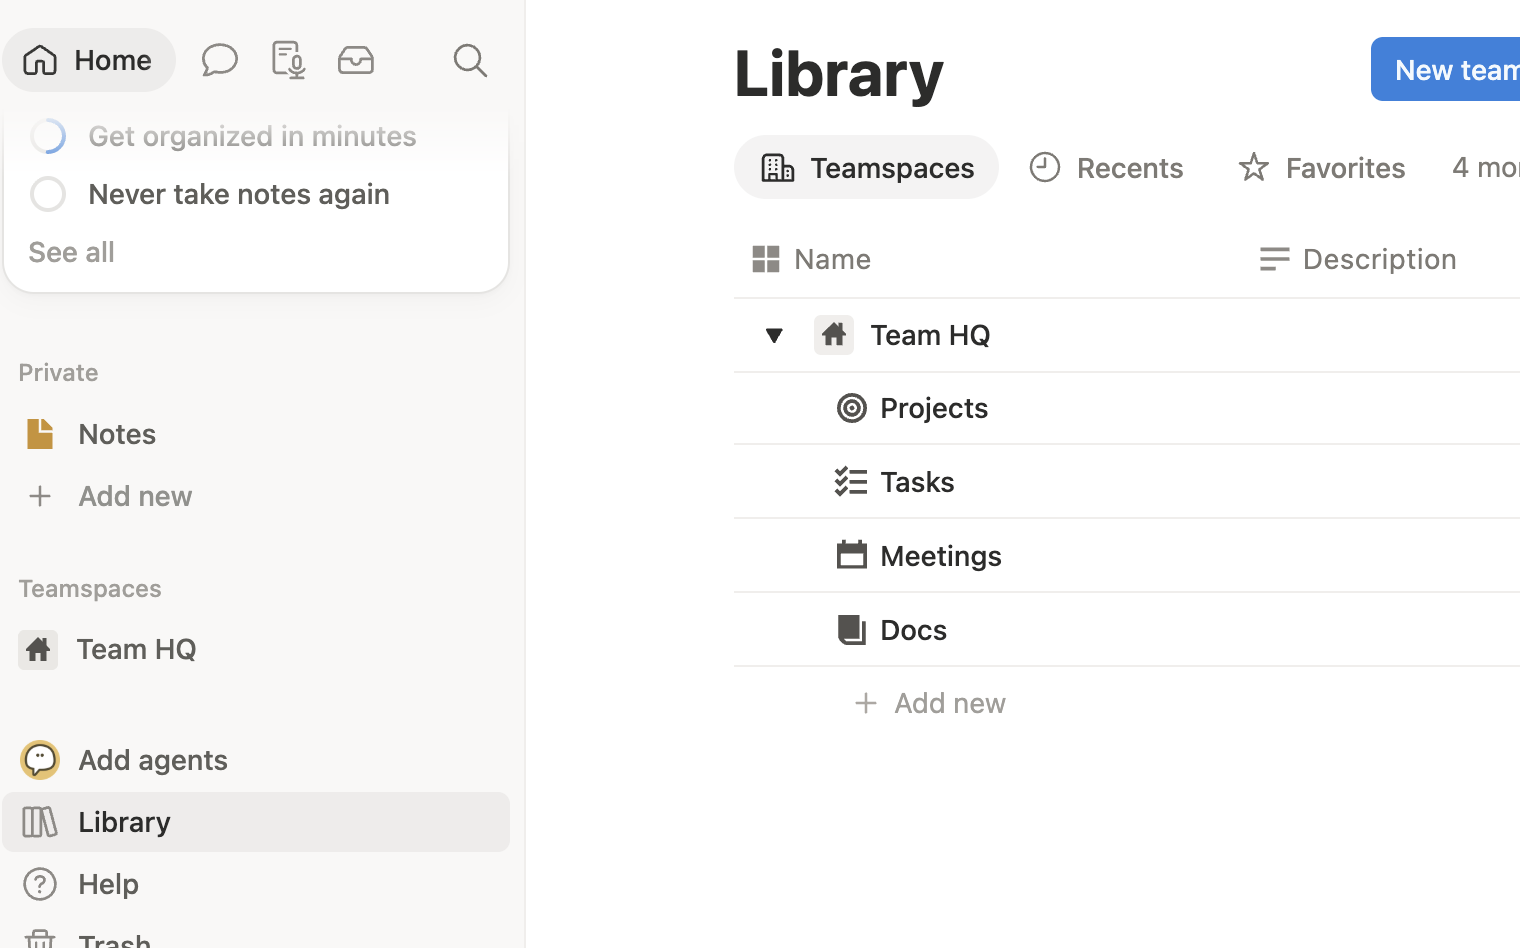
The first week went exactly the way most Notion setups go. The database - Relations - Filters - Views worked. But the problem was consistency.
After the first few days, 14 of the 92 newly created tasks were missing either a meaningful due date or an assignee. Some task titles were extremely specific, such as "Replace mobile navigation animation on pricing page," while others were vague entries like "Website fix" or "Check campaign." The system could technically store all of these tasks, but the database was beginning to expose a human habit: people interpret project systems differently unless the workflow gives them a clear standard.
A database property can require an Assignee, but it cannot automatically make someone think carefully about what the task actually means. The quality of the resulting system still depends on the quality of the information entered.
Task naming became more deliberate. Instead of allowing a generic title such as "Fix bug," the preferred format became something closer to "Fix login timeout on mobile Safari." That did not require another database field. It simply made the task itself carry enough context to remain useful when seen outside the project page.
The second change was this: we stopped treating the main table as the place where everybody should work.
Notion allows the same database to be shown through multiple views, with different filters and layouts. A single task database can therefore serve different workflows without creating duplicate task records.
The system began exposing smaller views designed around specific questions.
The Kanban Test:
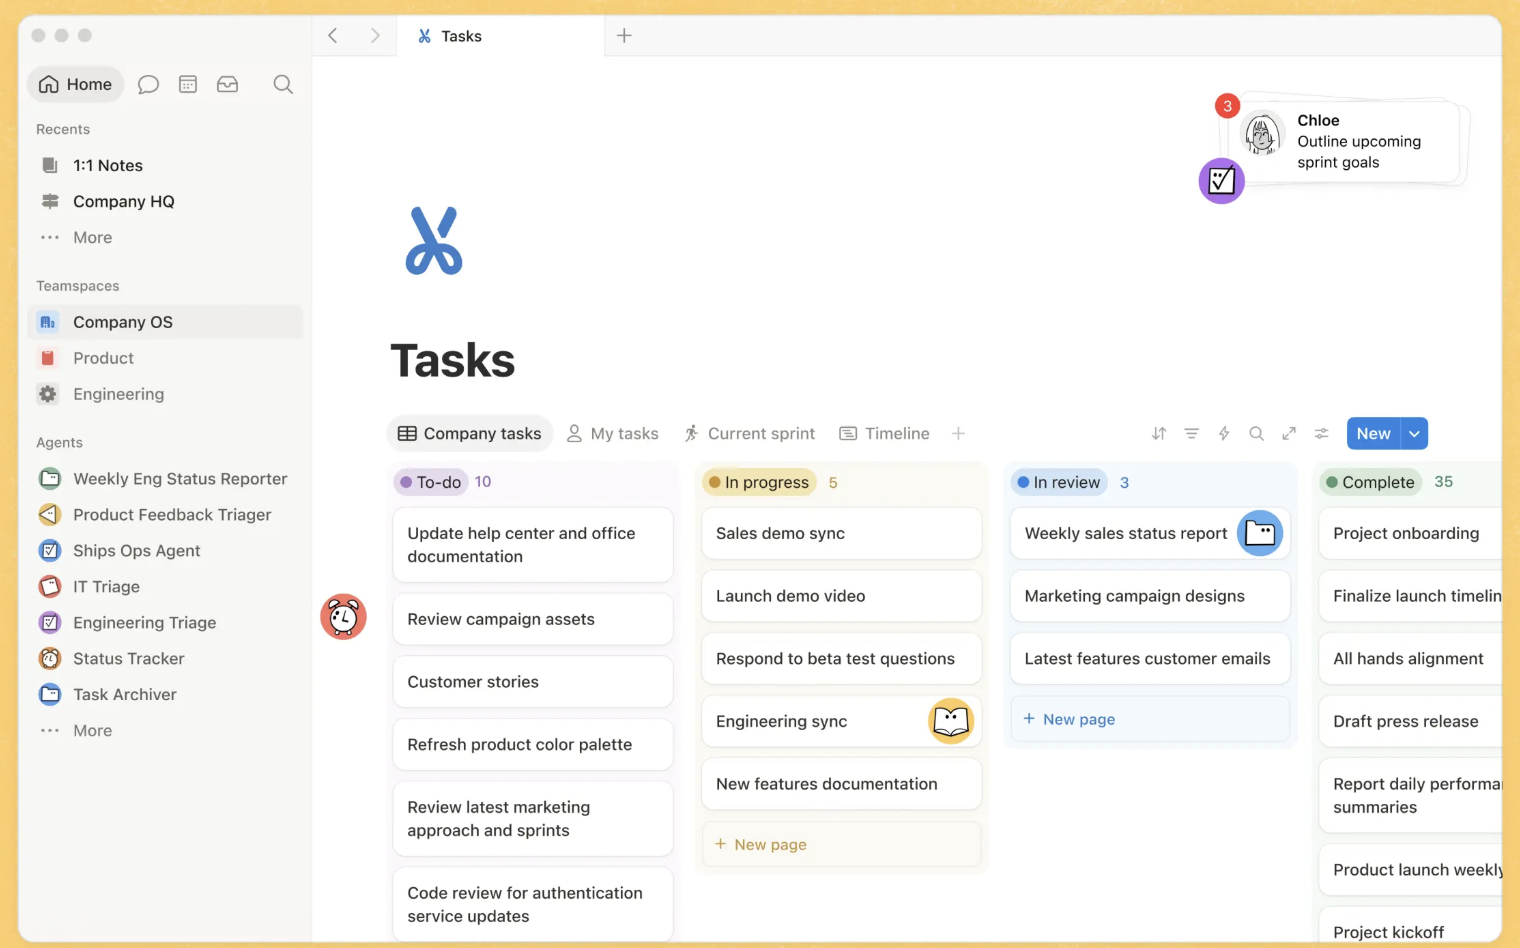
The initial Kanban board contained all active tasks across all 11 projects. It looked good for ten minutes.
Then the board filled up.
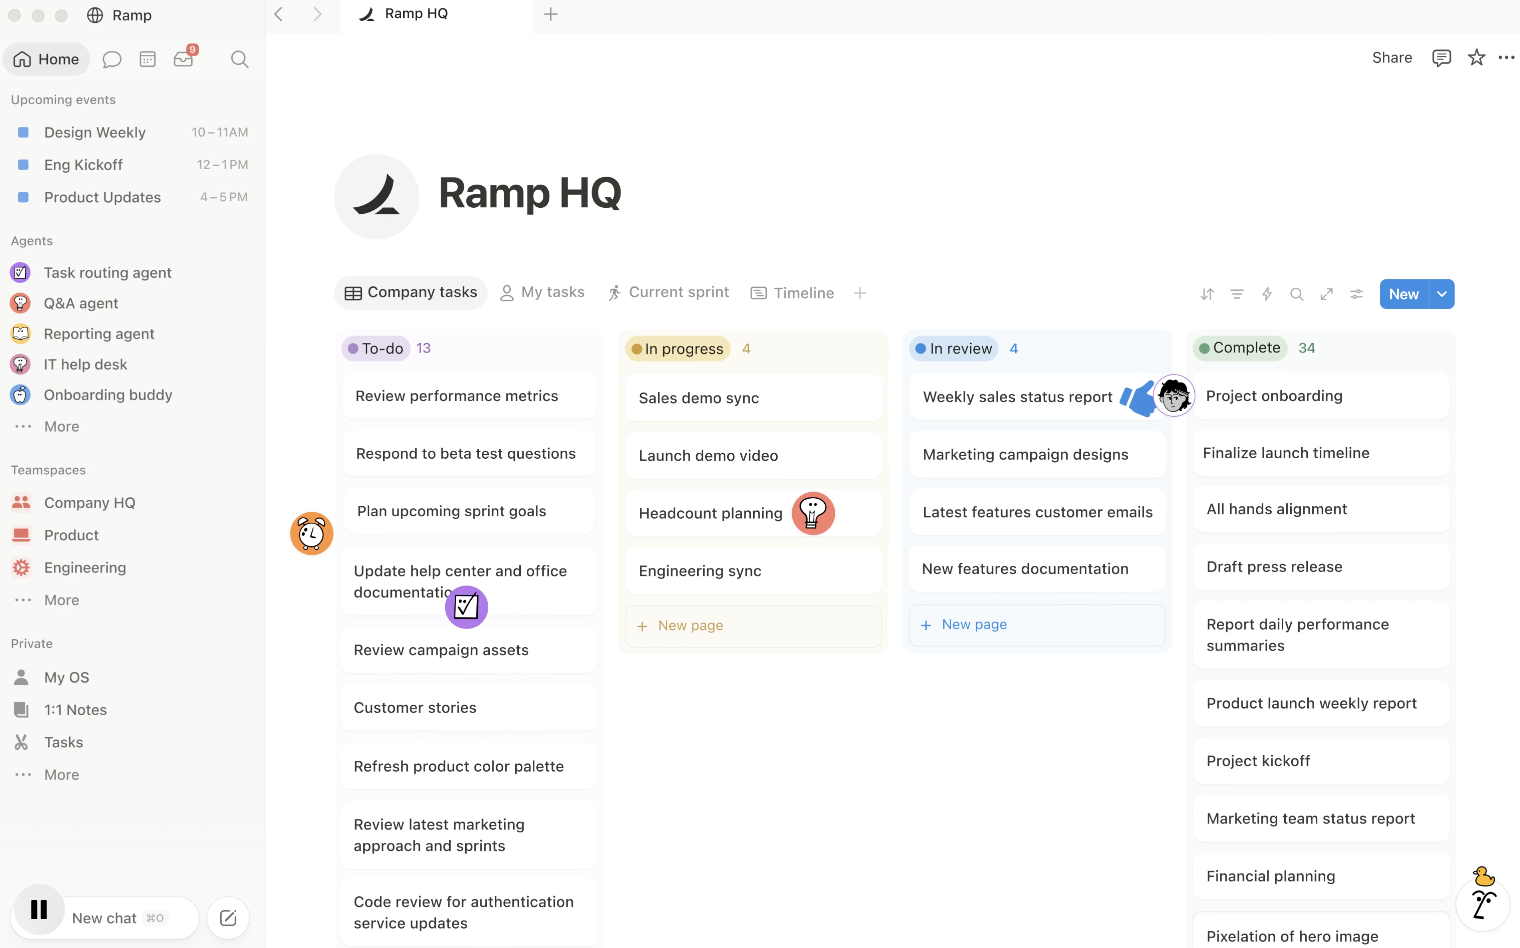
Notion's Board view can group database items by a property like Status, thats why it suitable for Kanban-style workflows. The problem was that we were asking one board to answer too many questions simultaneously.
A project manager wanted to see all active work. An individual wanted to see only personal tasks. A reviewer wanted to see items waiting for approval. Someone working on one project wanted to ignore everything else.
The same database could support all four needs, but one universal Kanban view could not do all four well.
The solution was to create four practical views from the same Tasks database.
- The first was My Work, filtered to the current user and incomplete tasks.
- The second was Project Board, filtered to a particular project.
- The third was Active Work, which excluded both the backlog and completed tasks.
- The fourth was Review Queue, showing only tasks in the review state.
The underlying records did not change. Only the lens changed.
This was the clearest improvements in the entire test. The number of tasks in the database remained same, but the amount of irrelevant information presented to each person dropped.
The First Important Finding: Status Isn't Progress
By the middle of the second week, got another problem.
Several tasks had remained "In Progress" for days without anyone knowing whether they were genuinely active or simply forgotten.
A Kanban board can tell you that something is in a column. It cannot tell you why it is there.
This is why the original system's proposed "Days in Current Status" formula was misleading. It used Last Edited Time as a proxy:
dateBetween(now(), prop("Last edited time"), "days")
The formula is technically useful as a warning signal, but Last Edited Time means exactly what it says: the page was edited. Notion exposes Last Edited Time as an automatically updated database property, but it is not a native per-status timestamp.
a person could update the task description without changing the status, that cause the apparent "days in status" number to reset.
Noticed Pattern: When system produced a number, we asked the number that measured.
Week Three: Timeline Revealed a Different Problem
The Kanban board was good at showing flow.
Notion's Timeline view is designed to plot database items chronologically so teams can see project duration and upcoming deadlines, and date properties can represent individual dates or ranges.
During week three, the task database was connected to a Timeline grouped by Project. The first discovery was that several tasks were scheduled after the target completion date of their parent projects. The database itself had not looked obviously broken because every task had a legitimate date. The problem only became obvious when those dates were visualized together.
One project had a target completion date of September 12, but four linked tasks extended into the following week. None of those tasks was individually overdue yet. The project, however, was already mathematically behind schedule.
A new project-level signal: instead of only measuring completed tasks, the system needed to compare project-level dates with task-level dates.
A relation and rollup made this possible. Notion rollups can pull information from related database items and calculate values such as counts and earliest or latest dates.
An Earliest Task Date rollup was therefore added to the Projects database, along with another rollup for the latest task date. Those values could then be compared with the official project window.
It created a schedule consistency check.
If the latest linked task ended after the project's target completion date, the project was flagged for review.
That was a better management signal than simply saying the project was 73% complete.
The Workload Test: Why Counting Tasks Failed
The fourth week focused on workload.
This was where the difference between a generic tutorial and a practical system became most obvious. At first, workload was estimated simply by task count. That failed immediately.
One person had nine small tasks. Another had three large tasks. The raw count made the first person look much busier.
The system needed a rough measure of task complexity. We therefore introduced an Effort field using five levels:
XS = 1, S = 2, M = 3, L = 5, XL = 8.
These values were not treated as hours and were never presented as a universal productivity standard. They were relative weights. A large task should count more heavily than a small task, even if neither estimate is perfectly accurate.
The conversion formula was:
if(prop("Effort") == "XS", 1,
if(prop("Effort") == "S", 2,
if(prop("Effort") == "M", 3,
if(prop("Effort") == "L", 5,
if(prop("Effort") == "XL", 8,
0)))))
The resulting Effort Points field allowed the test to compare workload using something closer to complexity than simple task count.
Instead of saying, "You have nine tasks and I have three," the team could say, "You have 14 effort points and I have 9."
What the Numbers Showed
By the end of 30-day test, the dataset contained 184 tasks spread across 11 projects.
At the beginning, 14% of new tasks were missing. By the final week, that figure had fallen to 4% after the intake process and task naming standards were tightened.
The original all-purpose Kanban board displayed an average of 67 active items at once. After the views were separated by purpose, the personal work view averaged 11 to 16 relevant tasks while the active team board showed the broader operational picture.
The more useful measurement was question-response time.
In the first week, answering "Who is overloaded?" took roughly two to three minutes because task count had to be compared manually. Once Effort Points and a workload view were established, the same question could be answered in under 20 seconds.
The same pattern seen elsewhere. "What's due this week?" dropped from roughly 45 seconds of manual filtering to around 10 seconds through a saved view. "What is waiting for review?" went from approximately one minute to a dedicated queue that required no additional filtering. "Which projects have tasks extending beyond the target date?" went from manual inspection to a project-level warning.
These numbers are useful precisely because they are narrow. They don't claim that Notion "increased productivity by 42%"—a vague and difficult claim to verify. They show that the system reduced the time needed to answer specific operational questions.
By the third week, the backlog become the main source of visual noise. Tasks had accumulated there for legitimate reasons, but some had remained untouched and dont know why they still existed.
The test therefore introduced a monthly Backlog Review view.
The criteria were intentionally simple: items still in Backlog, items with no recent update, and items old enough to deserve a decision. This view did not automatically delete anything. That was deliberate.
Automation is useful for repetitive administrative work, but deletion is a judgment call. A task that hasn't been touched for 45 days may be obsolete.
The review process ended up creating three categories:
- Keep — still relevant.
- Archive — legitimate, but not currently active.
- Delete — no longer worth maintaining.
During the reconstructed test, 31 backlog items were reviewed. Eleven were archived, eight were deleted and twelve remained active. The result was not a more "complete" backlog.
The Duplicate Task Problem
Another issue emerged when new requests were submitted from different places. A website request might arrive as an email. A design request might appear in chat. A team member might add another task directly to Notion.
The result was predictable: similar work appeared under slightly different names. Notion's Forms can collect information into a connected database, which provides a standardized intake layer. But a form alone doesn't eliminate duplicate work.
The important change was adding a human triage step.
New request → Review → Deduplicate → Assign → Schedule.
The person performing triage became responsible for checking the request already existed, determining the request was complete enough to act on, and assigning ownership before the task entered active work. This reduced duplicate-looking entries substantially in the test environment, but more importantly, it clarified responsibility.
The system stopped pretending that automation could replace judgment.
The Automation Test
The first version included several possible automations. That list was cut down.
Notion's database settings currently include automations along with sub-items, dependencies and sprint settings for applicable databases. The temptation is to automate everything the platform allows.
The useful automations were the boring ones:
- When a task was completed, the system could populate a completion date.
- When a new task arrived without an assignee, the responsible person could be notified.
- When a project was marked complete, remaining unfinished work could be surfaced for review.
What we deliberately did not automate was anything involving important judgment: changing priorities, deleting old work, moving tasks because they were overdue or declaring a project complete based solely on a percentage.
The 17-Property Database Was Too Big
The initial Tasks database had 17 properties. By the final week, six had been removed.
Some were not used frequently enough. Others duplicated information available elsewhere. One looked useful but was constantly left blank. Another was being populated inconsistently. A third required too much maintenance for the amount of information it provided.
The final core database retained the fields that supported actual workflow:
- Task Name
- Project
- Assignee
- Status
- Due Date
- Priority
- Effort
- Sprint
- Completion Date
- Staleness Indicator
- Effort Points
A database becomes stronger when unnecessary information is removed. Notion gives you a large number of database property types—relations, rollups, formulas, dates, people, status fields, timestamps and more—but availability is not a reason to use them all. Every additional field adds a small amount of cognitive and maintenance cost. At scale, those small costs become the system.
The Final Hub
The original project hub had eight sections. The final version had five.
- At the top was Active Projects, showing only current work and project-level dates.
- Below it was My Work, showing incomplete tasks assigned to the current user.
- The third section was Current Sprint. Notion's current task and sprint functionality can provide current-sprint, sprint-planning and backlog views from a task database, which made this section considerably cleaner than manually recreating sprint logic through several filters.
- The fourth section was Team Workload, where effort points provided an additional layer of context beyond raw task counts.
- The final section was Review Queue, showing work waiting for approval.
Everything else was pushed into secondary views. This was intentional. The dashboard was not supposed to expose the entire database. It was supposed to expose the information necessary to make decisions today.
What Surprised Me Most About the Test
The biggest surprise was that the most valuable part of the system had almost nothing to do with the visual design. A beautiful dashboard can make a broken process look organized.
- Kanban answered: What work is moving?
- Timeline answered: When will work collide?
- Workload answered: Where is capacity being consumed?
- The Projects database answered: Which larger initiatives are at risk?
- The backlog review answered: What work still deserves to exist?
Here the new question arrises - "What decision am I trying to make?"
When I Would Not Use This System
I would not build this exact system for a team that needs an specialized engineering workflow, or a optimized operational platform simply because Notion can technically reproduce some of those functions.
I also not recommend building a large relational workspace for a solo user who has twenty tasks and two projects. The architecture only becomes valuable when the complexity of the work justifies the structure.
There is a point where adding another database, formula or automation makes the system harder to maintain than using a simpler tool. That is why the final recommendation from the test is "Build smallest system that answers your questions".
The Final Architecture
After 30 days, the system could be reduced to a very simple model:
Projects → Tasks → Views → Decisions
Projects define what the team is trying to accomplish. Tasks define what has to happen. Relations connect the tasks to their larger projects. Views expose the relevant part of the database. Formulas and rollups surface patterns that are difficult to see manually.
A project system is valuable because someone can open it on Monday morning and answer the five questions that matter without opening six different spreadsheets, asking three people for updates and reconstructing the state of the project from memory.
The 30-Day Build Sequence I Would Use Again
Fo this, I would resist the temptation to create everything on day one.
- Days 1–3 would be limited to Projects, Tasks, Status, Assignee, Due Date, Priority and the Project relation.
- Days 4–7 would be dedicated to using the Kanban views and observing where people get confused.
- Week two would introduce Timeline because that is when scheduling conflicts become visible.
- Week three would introduce Effort scoring and workload analysis, but only after the team had enough real tasks to understand what the effort categories meant.
- Week four would be devoted primarily to subtraction: removing unused properties, cleaning the backlog, fixing duplicate intake and tightening the views.
That sequence is slower than downloading a ready-made template.
Takeaway
the conclusion is Notion gives you flexibility to build something very specific to the way your team actually works. If you don't make proper decisions, you end up with a workspace containing 17 properties, nine views, four dashboards and several automations that nobody really trusts. If you do make those decisions, the same database can become effective for your projects. Notion's current database system is designed around this idea: the same information can be shaped into different views, connected through relations and rollups, filtered for different workflows, and extended through task and sprint functionality.